VIDEO CAMERA
A video camera is a camera used for electronic motion picture acquisition, initially developed by the television industry but now common in other applications as well. The earliest video cameras were those of John Logie Baird, based on the electromechanical Nipkow disk and used by the BBC in experimental broadcasts through the 1930s. All-electronic designs based on the cathode ray tube, such as Vladimir Zworykin's Iconoscope and Philo T. Farnsworth's Image dissector, supplanted the Baird system by the 1940s and remained in wide use until the 1980s, when cameras based on solid-state image sensors such as CCDs (and later CMOS active pixel sensors) eliminated common problems with tube technologies such as burn-in and made digital video workflow practical.
Video cameras are used primarily in two modes. The first, characteristic of much early television, is what might be called a live broadcast, where the camera feeds real time images directly to a screen for immediate observation. A few cameras still serve live television production, but most live connections are for security, military/tactical, and industrial operations where surreptitious or remote viewing is required. The second is to have the images recorded to a storage device for archiving or further processing; for many years, videotape was the primary format used for this purpose, but optical disc media, hard disk, and flash memory are all increasingly used. Recorded video is used in television and film production, and more often surveillance and monitoring tasks where unattended recording of a situation is required for later analysis.
Modern video cameras have numerous designs and uses, not all of which resemble the early television cameras.
Professional video cameras, such as those used in television and sometimes film production; these may be studio-based or mobile. Such cameras generally offer extremely fine-grained manual control for the camera operator, often to the exclusion of automated operation.
Camcorders, which combine a camera and a VCR or other recording device in one unit; these are mobile, and are widely used for television production, home movies, electronic news gathering (including citizen journalism), and similar applications. Some digital ones are
Pocket video cameras.
Closed-circuit television (CCTV) cameras, generally used for security, surveillance, and/or monitoring purposes. Such cameras are designed to be small, easily hidden, and able to operate unattended; those used in industrial or scientific settings are often meant for use in environments that are normally inaccessible or uncomfortable for humans, and are therefore hardened for such hostile environments (e.g. radiation, high heat, or toxic chemical exposure).
Webcams are video cameras which stream a live video feed to a computer. Larger video cameras (especially camcorders and CCTV cameras) can be similarly used, though they may need an analog-to-digital converter in order to store the output on a computer or digital video recorder or send it to a wider network.
Digital cameras which convert the signal directly to a digital output; such cameras are often small, even smaller than CCTV security cameras, and are often used as webcams or optimized for still-camera use. The majority are incorporated directly into computer or communications hardware, particularly mobile phones.
Special systems, like those used for scientific research, e.g. on board a satellite or a spaceprobe, or in artificial intelligence and robotics research. Such cameras are often tuned for non-visible radiation for Infrared photography (for night vision and heat sensing) or X-ray (for medical and video astronomy use).
Objectives:
1.1 Getting to know the video camera.
1.2 Measuring the composite video on a video camera.
1.3 Determining the parameters of composite video.
Equipment Used:
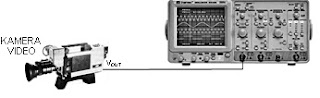
1 Video Camera
1 Oscilloscope 40 MHz and passive probe
An RCA cable connector - BNC (75 )
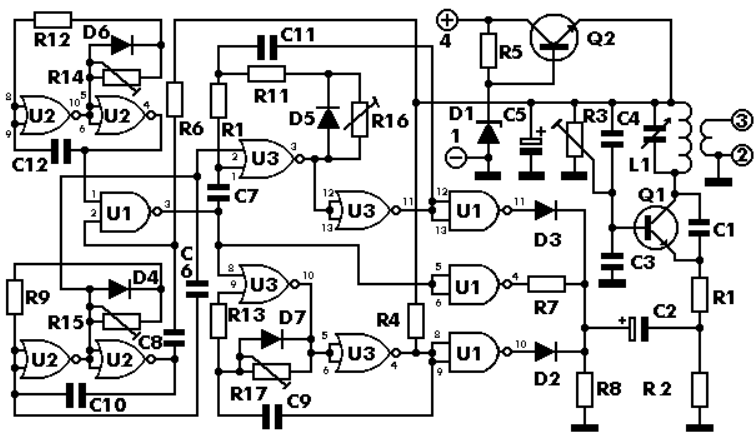
Circuit diagram:
Introduction:
A comprehensive idea of a TV camera function is depicted in Figure 3-2 and 3-3. In Figure 3-2 the camera is aimed at scene / view so that the optical image (optical image) can be focused on the target plate tube makers (pick-up tube). If you can look inside, you'll see the shadow-optical. The resulting video signal is shown by the oscilloscope waveform in the bottom left of the picture. Above is a monitor oscilloscope, which shows a reproduced image.

Figure 3-3. Block diagram that shows how to channel television camera output signal
Video komposit.Disini not shown reflection and focusing the camera tube.
Details of the video signal waveform which is more fully shown by the block diagram in Figure 3-3. At first, blanking pulses added to signal the camera. They cause the signal amplitude to the black levels so pengulangjejakan (retrace) the MRV will not be visible. Further alignment pulses (sync) is inserted. Alignment (synchronization) is required to set the time & MRV horizontal and vertical.
Camera signal with blanking and synchronization (sync) is called a composite video signal (composite video signal). Sometimes the term is not a composite video signal (noncompoxite video signal) is used to identify the signal with blanking camera but without alignment. Standard output level of the composite video signal from the camera is 1Vpuncak-to-peak (pp = peak to peak) with the alignment pulses in the down position for negative polarity.
Experimental Procedure
1. Set-up devices such as a picture he bag, connect the video camera out with input CRO.
2. ON the instrument.
3. Set the appropriate CRO to be easily observed (MODE on the TV-H position and / or TV-V).
When seeing a wave of horizontal synchronization MODE switch put on the TV-H position, while to see a wave of vertical synchronization MODE switch is placed vertically on the TV-V position.
4. Specify the synchronization pulses, blanking pulses, front and rear porch, and image information.
5. Image of the wave form and specify voltage.
Practical Results
1. Horizontal Image Mode (TV-H)


Fig. Composite Video to object Fig. Composite video for dark objects (black)
General


Fig. Sinc and enlarged color bearer
2. TV mode Picture-Vertical (TV-V)

Picture Mode TV-V


Picture Mode enlarged TV-V
Image Analysis

Conclusion